Understanding Bear Markets: Key Indicators for Recovery
Written on
Chapter 1: The Current Market Landscape
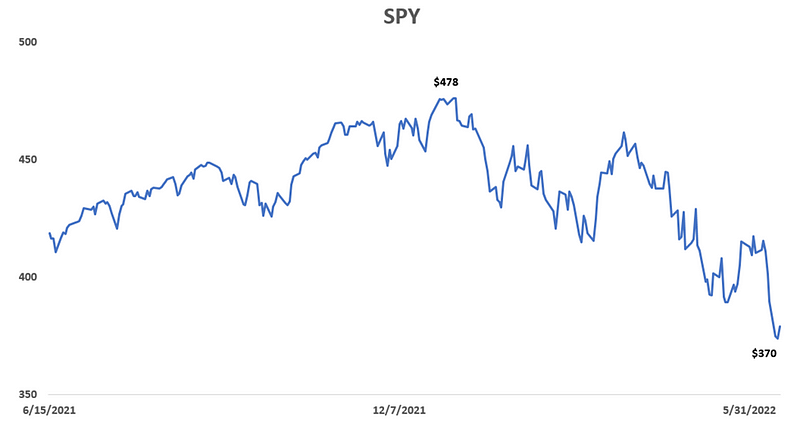
In the absence of the COVID-19 crash, we have been experiencing one of the longest bull markets on record. However, the recent surge in energy costs, supply chain disruptions, and inflation reaching a 40-year high have led to growing concerns about a potential recession. This unease is evident in the market, with the S&P 500 declining by 20% and the QQQ dropping by 32% from their peaks, officially marking the onset of a bear market. We are currently navigating through one of the most severe bear markets in history, with the first six months of this year being the worst in over half a century. Almost every asset class, including bonds, stocks, and commodities, has seen significant declines from their previous highs.

Photo by Erica Nilsson on Unsplash
No one enjoys a bear market, and the prevailing question during such times is often about identifying the bottom and anticipating the next bull market. If you can endure the bear market's duration and strategize accordingly, the potential for wealth generation on the other side can be remarkable. Historically, significant wealth has been created following bear markets.
This article will introduce three pivotal leading indicators that can assist in timing the market bottom and signaling the end of the current bear market.
Chapter 1.1: Key Indicators to Watch
The indicators we will focus on are:
- ISM: New Orders
- HMI: Housing Market Index
- Options Market: SKEW and Put-to-Call Ratios
Before we delve deeper, let's explore the typical duration of a bear market. Since 1928, there have been 26 bear markets, with an average duration of 289 days and an average decline of 36%. If we narrow the timeframe from 1949 to 2020, the average length of a downturn extends to 401 days. While not all bear markets are identical—some are shorter and others last longer—historically, the market tends to recover and deliver positive returns within five years.
Chapter 1.2: Understanding the Business Cycle
Each bear market is accompanied by a downturn in the business cycle. Understanding our position within this cycle can greatly influence asset allocation decisions. The cycles of boom and bust are intrinsic to capitalism, dating back to the 1800s. Economic downturns can lead to bear markets that may wipe out generational wealth, depending on their severity.
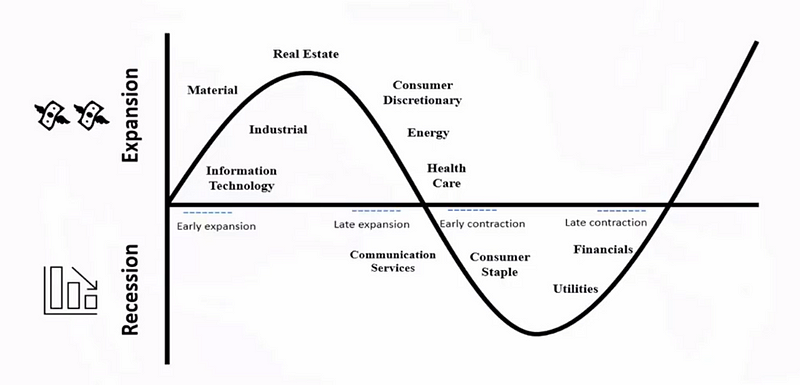
The following illustrates business cycles and which sectors perform well during each phase. Consumer staples and utilities typically outperform during recessions as they are essential goods. As the economy begins to recover, the financial sector often leads the charge, as companies seek to borrow money to expand operations, making loans a crucial source of revenue for banks.

The accompanying chart is sourced from my bestselling book, Stock Market Explained, which has consistently ranked highly in various categories for over two years. To explore more, check out the book HERE:
Chapter 2: Leading Indicators Explained
Leading Indicator 1: The Housing Market Index (HMI)
A significant leading economic indicator is the Housing Market Index (HMI), which is a monthly sentiment survey conducted by the National Association of Home Builders. This metric helps gauge the overall health of the economy. A declining HMI often signals an approaching economic downturn, while an increase suggests economic improvement. The HMI typically ranges from 0 to 100; when it falls below 50, it usually indicates a recessionary environment.
Leading Indicator 2: ISM New Orders
Another crucial leading economic indicator is the ISM (Institute for Supply Management) manufacturing index, which assesses new orders, production levels, employment, supplier deliveries, and inventory levels. Like the HMI, it also fluctuates between 0 and 100. Historical data indicates that the ISM is a reliable predictor of market bottoms; when it deviates significantly from the average, it can signal an impending market downturn or recovery. Observing a return to the average can provide critical insights for investors.

Leading Indicator 3: Options Market Sentiment
The options market serves as a valuable tool for gauging market sentiment. The VIX (Volatility Index) reflects the implied volatility of S&P 500 options, while the SKEW measures the disparity between at-the-money (ATM) and out-of-the-money (OTM) put options. The put-to-call ratio compares the open interest of put options against call options. Typically, for a bullish sentiment, the VIX should remain below 20, the SKEW around 150, and the put-to-call ratio between 0.3 and 0.7. A VIX above 20 indicates early panic, while above 25 suggests full-blown panic. If the SKEW dips below 130, it indicates a predominance of ATM puts, signaling a likely sell-off. Additionally, a put-to-call ratio exceeding 1.3 points to a bearish market sentiment.
At present, the VIX is at 28, the SKEW is 119, and the put-to-call ratio stands at 1.34, indicating a bearish outlook.
What are the Three Signs of the Bear? - This video discusses three crucial indicators to identify when a bear market may be coming to an end.
3 Signs Indicating the End of a Bear Market - This video explores three essential signs that suggest a bear market may be concluding.