Nvidia's Stock Journey: Analyzing Five Years of Growth
Written on
Chapter 1: Overview of Nvidia's Stock Performance
In this new series, we will explore technology stocks, focusing on their price trends over a five-year period. For this analysis, the timeframe selected is from 2019 to 2023, with Nvidia as our primary subject.
We will investigate the top 10 single-day price changes during this period, encompassing two significant movements each year—one upward and one downward. Let’s break down Nvidia's stock journey.
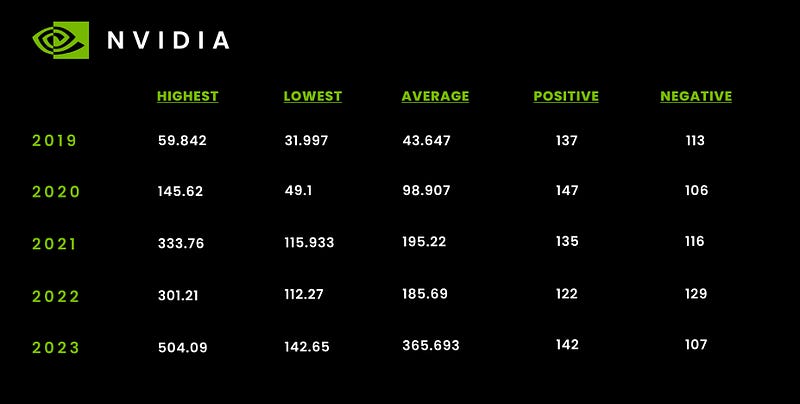
The following infographic illustrates the highest, lowest, and average stock prices over the years, along with the number of days the stock fluctuated up or down each year.

Price History of Nvidia Shares
2019 - Average Price: $43.65
- January 28th - 13.82% Down: Deteriorating macroeconomic conditions, particularly in China, negatively impacted investor sentiment. The economic instability in significant markets often leads to decreased consumer expenditure and investment, which affects companies like Nvidia reliant on global demand.
- August 16th - 7.25% Up: Nvidia reported positive Q2 results on August 15th, with revenue of $2.58 billion, a decline from the previous year’s $3.12 billion but an increase from the prior quarter’s $2.22 billion. CEO Jensen Huang noted, “Real-time ray tracing is the most significant graphics innovation in a decade.”
2020 - Average Price: $98.91
- March 16th - 18.45% Down: The stock market experienced a significant crash in March 2020 due to the onset of Covid-19, leading to a drastic drop in the Nasdaq of 12.3%. This day was marked as Black Monday II.
- March 24th - 17.16% Up: Just a week later, the market rebounded as optimism surged regarding a sweeping fiscal stimulus plan to support the economy during the pandemic.

2021 - Average Price: $195.22
- February 25th - 8.22% Down: Despite surpassing quarterly earnings forecasts, the stock dipped as CEO Jensen Huang downplayed the potential for growth in the cryptocurrency mining sector. He indicated a shift in focus from mining to gaming.
- November 4th - 12.04% Up: Following a buy recommendation from BofA, Nvidia's stock surged as it was positioned as a key player in the emerging metaverse technology.
2022 - Average Price: $185.69
- September 13th - 9.47% Down: The equity markets faced their most significant single-day declines since June 2020, leading to heightened investor anxiety about economic conditions.
- November 10th - 14.33% Up: The unveiling of the Volvo EX90 SUV, powered by Nvidia's technology, marked a pivotal moment in the company's journey, showcasing its advancements in AI and automation.

2023 - Average Price: $365.69
- January 30th - 5.91% Down: Stocks experienced a decline ahead of a significant earnings season and potential interest rate hikes, reflecting broader market trends.
- May 25th - 24.37% Up: Nvidia announced its financial results for the first quarter of fiscal 2024, reporting a quarterly revenue of $7.19 billion, signaling a booming demand for AI-related products and significantly boosting stock prices.

Nvidia's stock journey over the past five years reveals an extraordinary increase of 1354.18%. Of the 1258 trading days during this period, only 687 ended with gains, while 571 saw declines. This statistic underscores the significance of maintaining long-term investment positions, as temporary downturns can lead to substantial overall gains.
Thank you for following this analysis. Stay tuned for more insights into the evolving landscape of technology stocks.
Chapter 2: Video Insights on Nvidia's Market Position
In the video titled "YOU'RE WRONG! SHOCKING Wall Street Research SILENCES Investors On Nvidia Stock," expert analysis reveals how investor sentiments have been shaped by current market trends and Nvidia's strategic decisions.
The second video, "How Nvidia rose to the top of Wall Street | World Business Watch," provides an in-depth exploration of Nvidia's ascent and its implications for the future of technology investing.